
12 metrics you can’t afford to ignore this peak season—and how to act on them with Shippo Intelligence

Shipping data has always told a story—just not one most brands could see clearly. With Shippo Intelligence, scaling e-commerce businesses can finally see the why behind their shipping costs and delivery performance. Built right into the Shippo API Portal, this new tool turns shipping data into clear, actionable insights that help you save money, prevent delays, and keep customers happy. No integrations, setup, or spreadsheets required.
And as peak season ramps up, these insights matter more than ever. Shippo Intelligence helps you spot issues before they snowball, like early signs of package delays or creeping rate increases, so you can protect profit margins and customer trust.
Here are 12 essential metrics scaling brands can’t afford to ignore this peak season—and exactly where to find them in Shippo Intelligence to take action fast.
1. Is your shipping volume trending as expected?
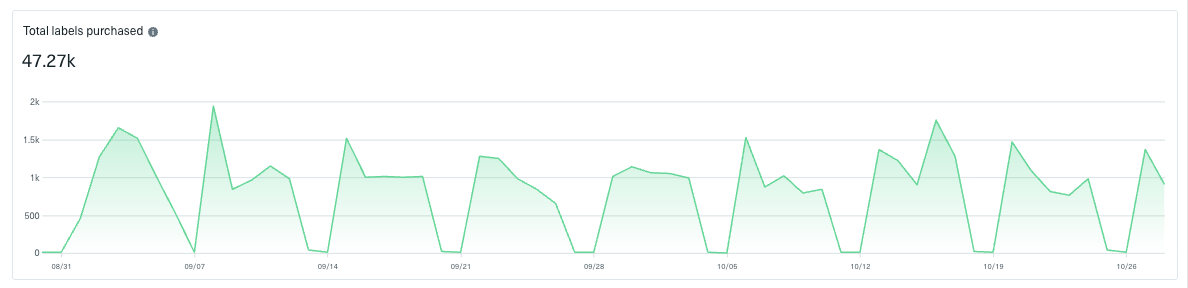
Your label volume tells the story of how your fulfillment operation is pacing. When volume spikes, it can strain warehouse capacity or carrier pickups; when it dips, it may signal slowdowns or automation issues. Shippo Intelligence helps you spot both early, so you can act before delays affect customers.
The Intelligence chart that answers this question:
Labels → Total labels purchased (time-series line chart).
How to interpret it
- Steady or gradually rising: Indicates a healthy, consistent pace.
- Sharp spikes: Suggest surging order volume that may soon exceed fulfillment or carrier capacity.
- Sudden dips: Point to possible slowdowns in order flow, batching, or automation triggers.
What to do next
- For spikes, extend shifts, rebalance fulfillment load, or coordinate with marketing to pace promotions.
- For dips, verify automation and integration flows are running smoothly.
- Bottom line: Spotting spikes or dips early prevents bottlenecks that snowball into refunds and reships.
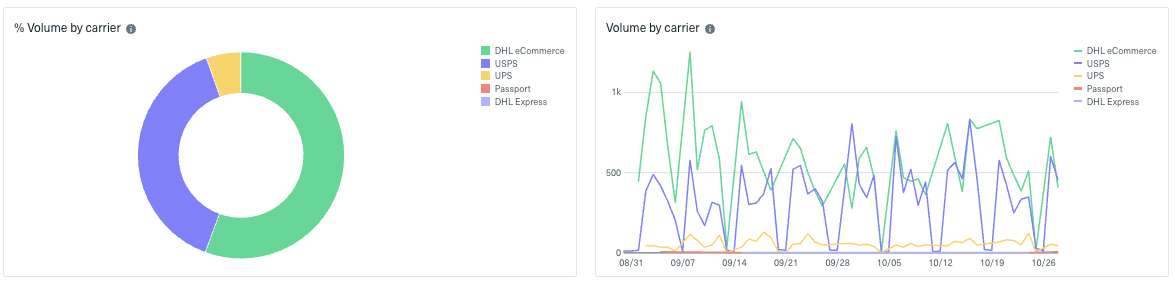
2. How balanced is our carrier mix—and is it shifting unexpectedly?
Track whether your shipping volume is distributed across multiple carriers or starting to skew toward one partner. A balanced carrier mix reduces your exposure to delays, rate fluctuations, and unexpected surcharges.
The Intelligence chart that answers this question:
Labels → % Volume by carrier (donut) and Volume by carrier (time-series).
How to interpret it
- Stable distribution: Healthy diversification across carriers.
- Rising reliance on a single carrier: Watch for signs that your mix is becoming unbalanced, which could expose you to higher costs or unexpected surcharges—and increase risk if that carrier experiences delays or service disruptions.
- Sudden shifts: Could signal routing logic errors, carrier outages, or changing customer demand patterns.
What to do next
- Redistribute zones to secondary carriers for risk mitigation.
- Review WMS/OMS routing rules for accuracy.
- Confirm each carrier’s holiday capacity commitments and performance expectations.
3. Are we over-relying on certain service levels?
See whether your team’s shipping mix is leaning too heavily toward any one service level—whether that’s express, 2-day, or economy. An unbalanced mix can quietly inflate costs, create inefficiencies in fulfillment timing, or lead to carrier-capacity challenges during peak.
The Intelligence chart that answers this question:
Labels → % Volume by service level (donut) and Volume by service level (time-series)

How to interpret it
- Stable mix: You’re maintaining a healthy balance between delivery speed and cost efficiency.
- One service level climbing: Teams may be overusing that tier to compensate for fulfillment timing, inventory placement, or delivery promises.
- Other tiers dropping: A signal that routing logic or fulfillment timing may be pushing orders into one category unnecessarily.
What to do next
- Review your service-level mix regularly to confirm it aligns with actual delivery needs and margin goals.
- Adjust shipping-speed messaging on PDPs and at checkout to guide shoppers toward the right delivery options.
- Revisit internal fulfillment cutoffs to prevent unnecessary upgrades or delays.
- Audit automation rules that may be defaulting to the same tier when inventory ships from specific locations.
4. Are our rated label prices climbing—and where?
Spot whether rate creep is happening by carrier or service level, especially as peak demand shifts your shipping mix.
The Intelligence chart that answers this question:
Labels → Average rated label price (time-series); Average rated label price by carrier; Average rated label price by service level.

How to interpret it
- All carriers trending up: Indicates market-wide rate pressure or higher average shipping zones.
- One carrier or service level spiking: Could point to increased use of faster service levels or higher-cost zones.
- Wide swings by week: Often reflect changes in your shipping mix, like sending more long-distance or expedited shipments one week than another.
What to do next
- Shift short-haul zones to lower-cost services.
- Audit fulfillment routing to ensure service levels match delivery promises.
- Recalculate contribution margins and adjust free-shipping minimums if needed.
5. Are shipments flowing normally—or starting to stall?
Use in-transit data to confirm whether your network is moving smoothly or slowing down. Elevated in-transit counts aren’t bad—but persistent elevation signals congestion.
The Intelligence chart that answers this question:
Shipments → In-transit → Total in-transit (time-series) and In-transit by carrier (stacked bars).


How to interpret it
- Predictable flow: Healthy network movement.
- In-transit volumes piling up: Shipments aging in transit—potential bottlenecks.
- One carrier trending higher: Localized delays or capacity limits.
What to do next
- Flag aging shipments and proactively update customers.
- Temporarily shift outbound volume to faster-moving carriers.
- Review pickup frequency and staging cutoffs.
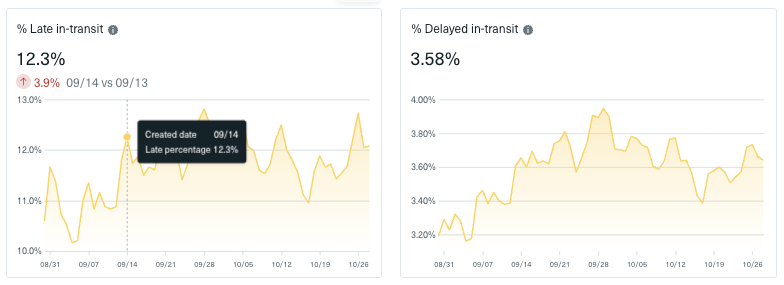
6. Which carriers are showing rising late or delayed shipments?
Monitor delivery performance by carrier and service level to spot early warning signs before customer complaints start.
The Intelligence chart that answers this question:
Shipments → % Late or Delayed in-transit (time-series); Late/Delayed by carrier (bars); Total late/delayed by carrier (donuts).
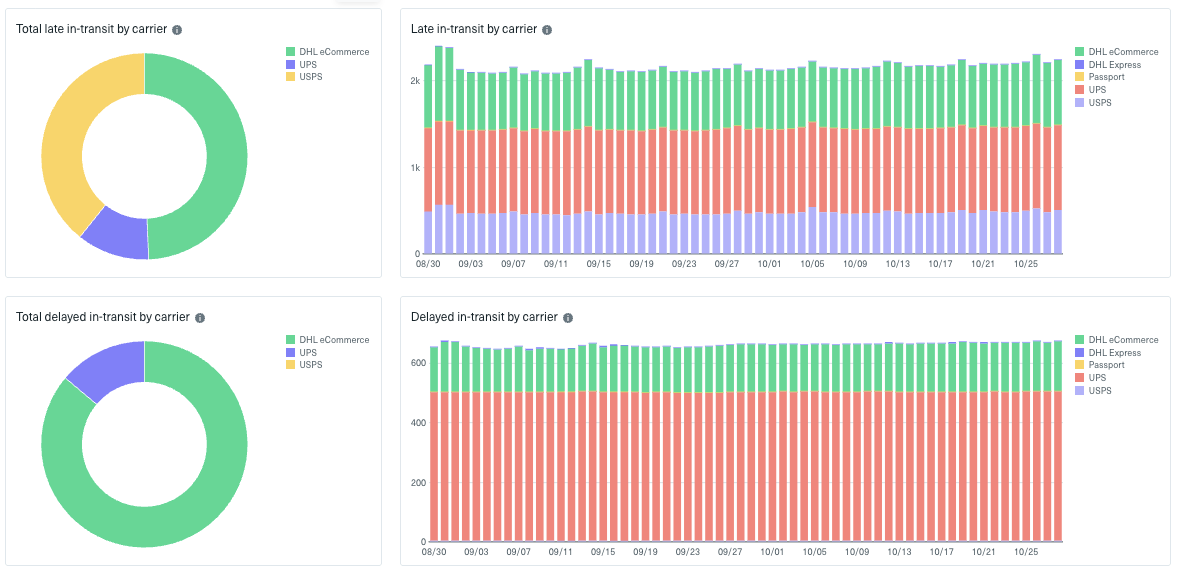
How to interpret it
- Flat lines: Stable performance.
- One carrier’s delays are increasing: Service degradation or local congestion.
- All rising together: Likely weather or systemic issue.
What to do next
- Reroute new shipments away from struggling carriers.
- Provide data-backed evidence to carrier reps for remediation.
- Adjust checkout ETAs for affected lanes.
7. Have any shipments failed to enter the carrier network?
Before delays or failed deliveries even occur, check whether labels are being created but never scanned by a carrier—these are shipments that never entered the network. During peak, this can happen when pickup schedules slip, batches aren’t closed, or manifests fail to transmit.
The Intelligence chart that answers this question:
Shipments → Delivery status → % Shipments per status (donut) and Shipments per status (stacked bars).
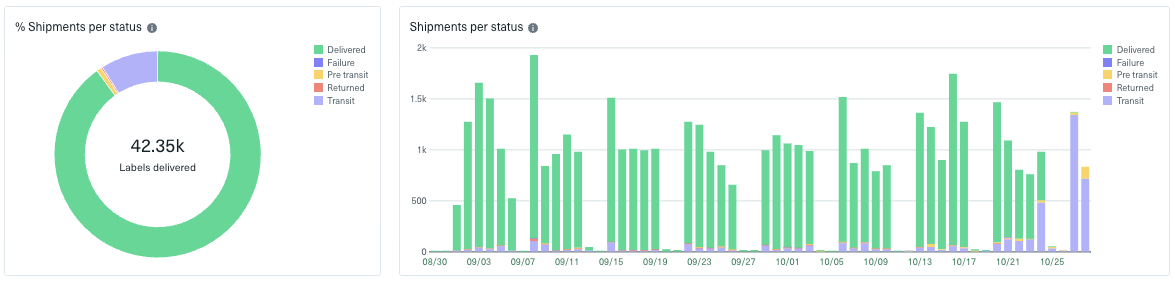
How to interpret it
- Pre-transit volume steady or declining = Healthy fulfillment flow.
- Pre-transit spike = Shipments waiting on pickup or data-ingest failures.
What to do next
- Verify manifests and pickup requests were processed.
- Coordinate same-day pickups or drop-offs for aging pre-transit orders.
- Reprint or cancel stale labels to avoid billing mismatches later.
8. Why are some deliveries failing—and how big is the risk?
Dig into unsuccessful deliveries to see what’s behind failed shipments—address errors, missed recipients, or damaged packages.
The Intelligence chart that answers this question:
Shipments → Delivery status → Unsuccessful deliveries (time-series); Unsuccessful by reason (stacked bars + donut).
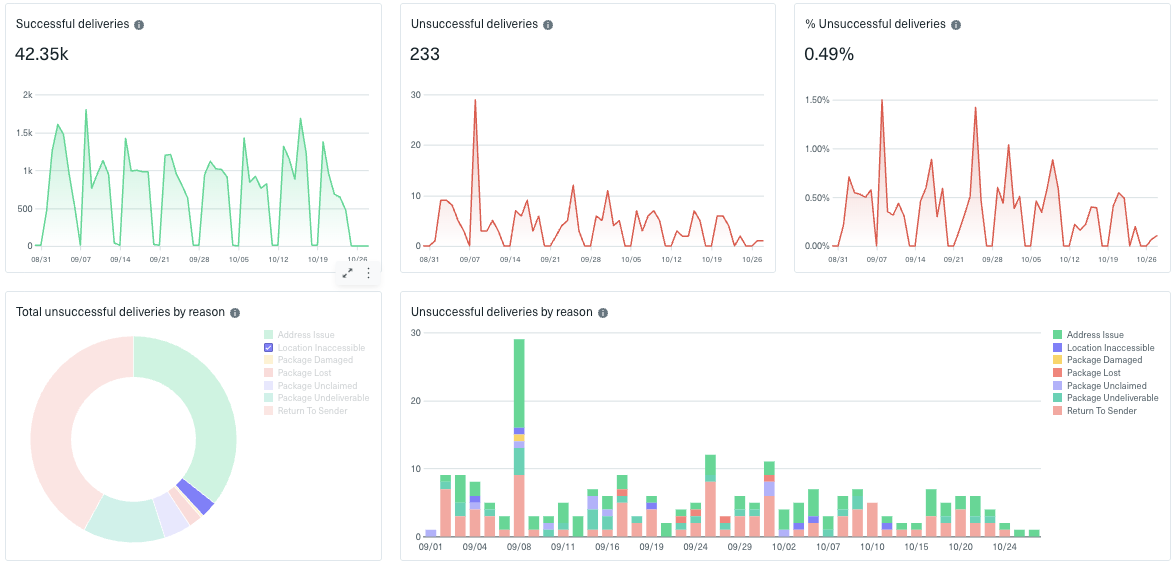
How to interpret it
- Address issues: Data validation gaps.
- Undeliverable/damaged: Label or packaging process issue.
- Customer unavailable: Communication or scheduling misalignment.
What to do next
- Enforce address validation via Shippo’s API.
- Audit packaging and labeling workflows.
- Offer pickup-point options or SMS updates for better delivery success.
9. Which carriers are driving the most failed deliveries?
Identify whether a particular carrier is responsible for most failed or returned shipments.
The Intelligence chart that answers this question:
Shipments → Delivery status → Total unsuccessful by carrier (donut); Unsuccessful by carrier (stacked bars).

How to interpret it
- One carrier consistently highest: Reliability issue to escalate.
- Even distribution: Failures are likely operational, not carrier-based.
What to do next
- Escalate with the carrier’s account rep using the data visualization.
- Shift time-sensitive shipments to higher-performing carriers.
- Prioritize customer resolutions for affected orders.
10. Are certain ship days hurting delivery performance?
Some ship days (like Fridays) naturally lag due to weekend processing delays. Identify patterns so you can plan fulfillment and promos around your best-performing days.
The Intelligence chart that answers this question:
Shipments → Performance → Delivery performance by date shipped; Delivery performance by day of week shipped; % Early/On-time/Late (time-series).
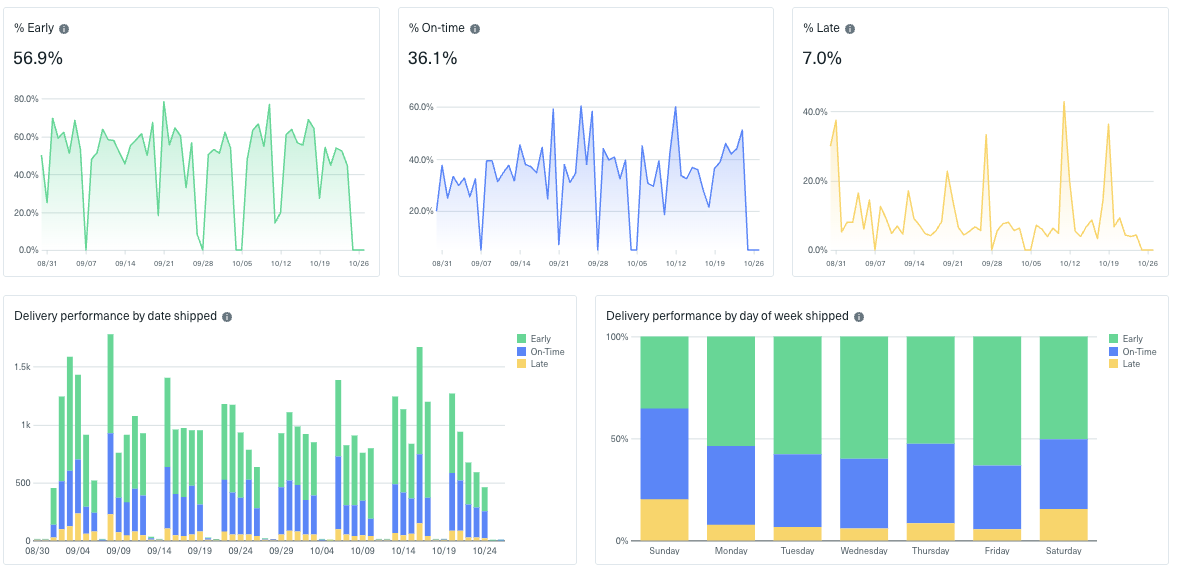
How to interpret it
- Even performance: Healthy fulfillment cadence.
- Fridays or Saturdays trending late: Weekend carrier bottlenecks.
- Wide swings by day: Inconsistent cutoff times.
What to do next
- Move customer order cutoffs earlier for slow-performing ship days.
- Stage Friday orders for Monday dispatch.
- Align marketing drops with your best-performing fulfillment days.
11. Which zones are slowing us down?
Performance often varies by region. This view shows where shipments are lagging and which carriers or services perform best by zone.
The Intelligence chart that answers this question:
Shipments → Performance → Average transit time by zone; Delivery performance by zone.
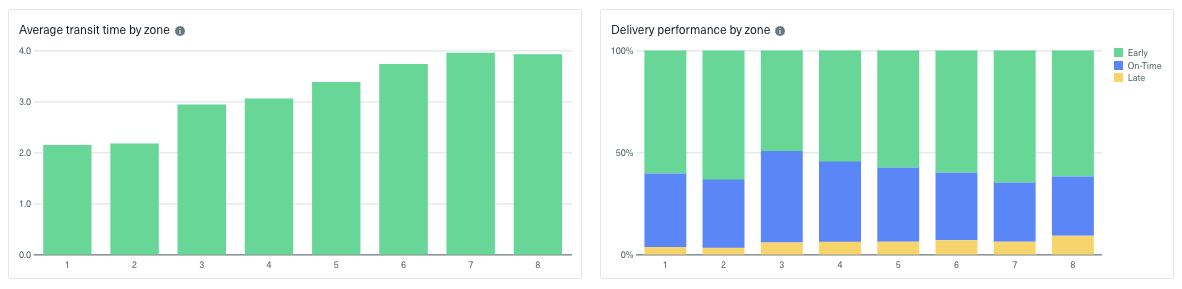
How to interpret it
- Certain zones consistently slow: Regional bottlenecks or longer carrier handoffs.
- Carrier performance varies by zone: Reveals which carriers deliver faster in specific regions.
What to do next
- Reassign underperforming zones to carriers with stronger regional data.
- Adjust ETAs on your site by ZIP or zone.
- Add buffer days to promises for slower zones during peak.
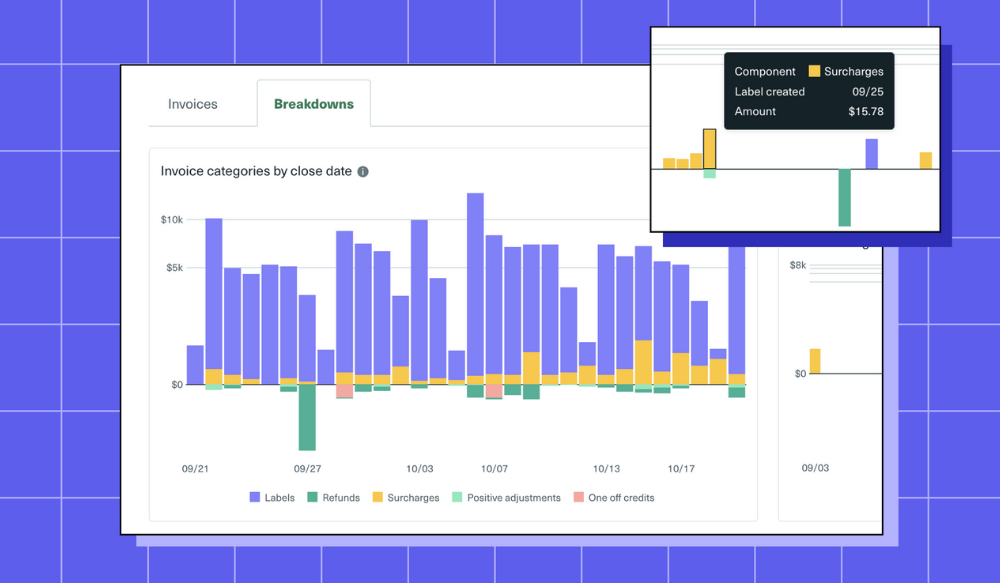
12. Are we leaking margin to surcharges or invoice discrepancies?
Hidden costs can quietly eat into profit during peak. Track whether billed costs match rated prices—and why differences occur.
The Intelligence chart that answers this question:
Spend → Invoices → Surcharges, Rated vs. Invoiced Amount (line); Rated vs. Invoiced by Carrier (bar).
Spend → Breakdowns → Invoice categories by close date or label date.
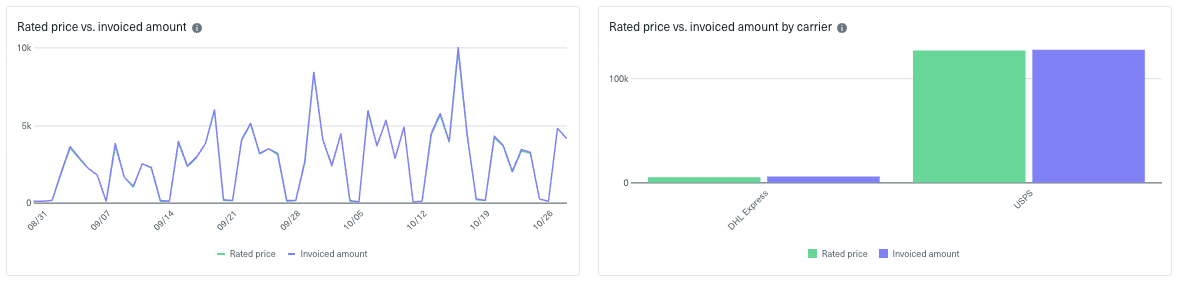
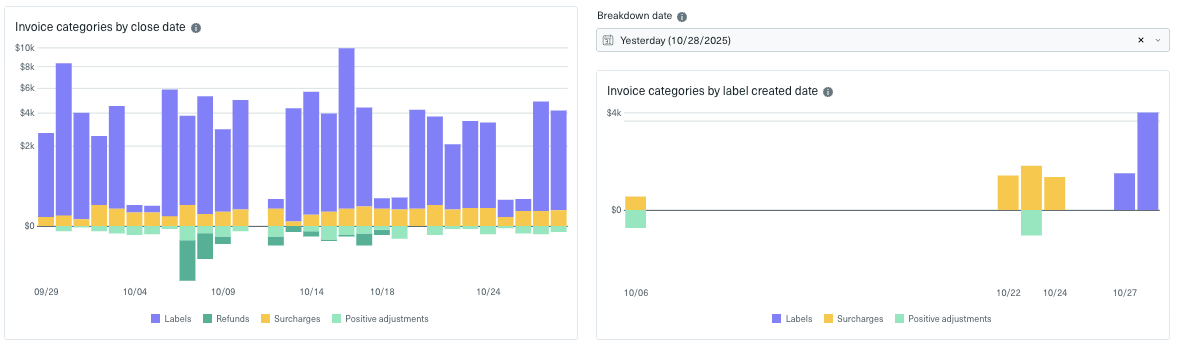
How to interpret it
- Invoiced > rated: Indicates unexpected surcharges or dimensional adjustments.
- Positive deltas (refunds): Credits applied—worth monitoring for frequency or root cause.
- One carrier consistently off: May signal billing mismatch or recurring contract discrepancies.
What to do next
- Identify which carriers or invoice categories are driving the biggest variances, then review those accounts or service levels more closely.
- Review packaging dimensions and address accuracy to minimize post-shipment adjustments.
- Use this data as a conversation starter for auditing carrier invoices or negotiating better terms after peak.
Turn visibility into action with Shippo Intelligence
Each of these 12 metrics represents a shift, from reacting after the fact to anticipating what’s next. With Shippo Intelligence, you can see issues as they start and act before your customers ever notice.
By turning complex shipping data into simple, actionable insights, scaling brands can cut costs, deliver more reliably, and strengthen carrier partnerships—all from one view inside Shippo.
Peak season always brings surprises, but now you’ll have the clarity and confidence to stay ahead of them.
To explore how Shippo Intelligence can power your shipping strategy, connect with a Shippo expert.
Looking for a multi-carrier shipping platform?
With Shippo, shipping is as easy as it should be.
- Pre-built integrations into shopping carts like Magento, Shopify, Amazon, eBay, and others.
- Support for dozens of carriers including USPS, FedEx, UPS, and DHL.
- Speed through your shipping with automations, bulk label purchase, and more.
- Shipping Insurance: Insure your packages at an affordable cost.
- Shipping API for building your own shipping solution.
Stay in touch with the latest insights
Be the first to get the latest product releases, expert tips, and industry news to help you save time and money on shipping.
Loading...
Thanks for your submission!


.png)
.png)
.png)
.gif)


