Turn your shipping data into action

See what’s new

Stay ahead of delays and delivery issues
The Labels Dashboard tracks label volume, carrier service mix, and rate trends. Enhanced filtering, drill-downs, and interactive maps help you spot spikes early, plan staffing, and adjust routing or fulfillment decisions.

Act fast
The Shipments Dashboard tracks carrier performance, transit times, and delivery outcomes with daily data updates. Interactive maps show where delays are happening by state, region, or lane so you can act before they impact margins.

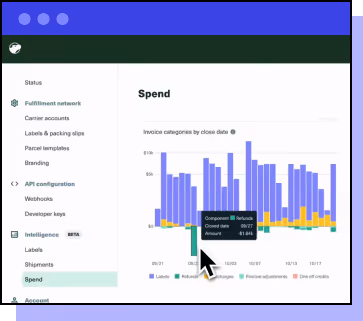
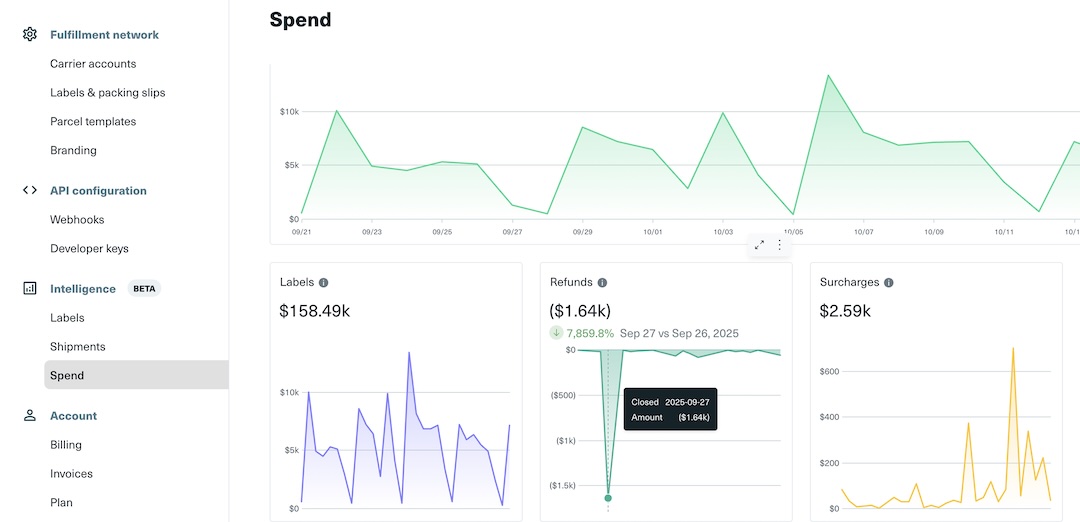
See your true costs
The Spend Dashboard compares quoted and billed shipping costs, showing rated and invoiced spend in one place. Surcharge breakdowns by carrier, service level, and reason help you pinpoint cost drivers, investigate hidden fees, and reduce unnecessary spend.


AI insights for smarter shipping
- Shipping cost changes
- Carrier performance shifts
- Personalized recommendations
Shippo Intelligence goes beyond standard shipping analytics
Data Category
Competitors
Others


Capability
Competitors
Others
Turn your questions into answers and action
Shippo Intelligence turns reporting into an operational advantage


Tynan Dutson
Anomaly detection coming soon

Anomaly detection coming soon
You already ship with Shippo. Why add another analytics tool?