
Why is my FastAPI throughput so low?


FastAPI is a modern, highly performant, framework to build web applications and we’re using it to build a new billing platform at Shippo. Our application must be able to handle a couple hundreds of thousands of webhook requests on a given day in order to close invoices. In this blog post we’ll go over the process to discover that we weren’t able to process the expected amount of requests and how we fixed an issue that made our application 5x slower.
Baseline
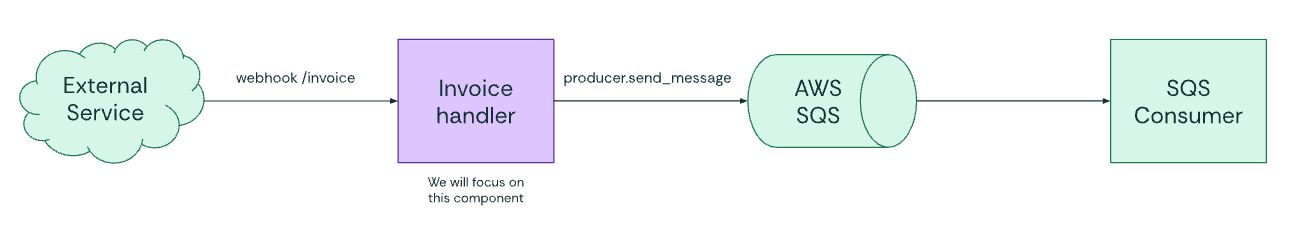
Our webhook handler is quite simple. We receive a request and send it to SQS to be processed in the background so that we can return as fast as possible to the caller.
Below you can see a code snippet of our handler.
@router.post(“/invoice”)
async def invoice_handler(
   request: Request,
   producer: Producer = Depends(Producer),
) -> JSONResponse:
   body = await request.body()
   body_str = body.decode("utf-8")
   try:
Invoice.model_validate_json(body_str)
       producer.send_message(body_str)
   except ValidationError as e:
       ...
   except Exception as e:
       ...
   return JSONResponse(status_code=200, content={...})
The handler reads the request body, validates the content and sends the content to SQS. Even though the handler is simple and everything was working as expected, we decided to perform some load tests to verify how it would behave. We used Vegeta to perform these tests and got the following results
vegeta attack -rate 500 -duration 5s
We weren’t expecting the fastest webhook handler of all time, but the numbers above were quite below expectations. Taking almost 1s for the fastest response and 42 RPS is quite low for a modern web server. At this moment we started looking around FastAPI docs and performance optimization tips that we could be missing and stumbled on Performance tips by the FastAPI Expert — Marcelo Trylesinski. However, our setup was already using most of those tips meaning that it was indeed something related to how we were using FastAPI that was slipping through our fingers.
Looking at the code snippet above, can you spot something odd about it?
Async and threads
The issue is probably not clear from that snippet, but we were aware of it from the beginning. We just didn’t know how FastAPI handled such requests. The call producer.send_message(body_str) is synchronous/blocking, but our handler is async def invoice_handler. If you ever worked with async code, you know you should never block the event loop since other “threads” won’t do any work unless you await. However, our initial understanding was that FastAPI was using multiple OS threads to handle requests, and there were many event loops to run them on. We couldn’t be more wrong. Async handlers in FastAPI run on a single event loop on the main thread, sync handlers run on a thread pool. This means that while making a request to post a message to SQS we were blocking the whole web server and it couldn’t handle other requests. Once we understood it, we moved the blocking call to the thread pool.
from fastapi.concurrency import run_in_threadpool

@router.post(“/invoice”)
async def invoice_handler(
   request: Request,
   producer: Producer = Depends(Producer),
) -> JSONResponse:
   body = await request.body()
   body_str = body.decode("utf-8")
   try:
Invoice.model_validate_json(body_str)
       await run_in_threadpool(producer.send_message, body_str)
   except ValidationError as e:
       ...
   except Exception as e:
       ...
   return JSONResponse(status_code=200, content={...})
Running the same test led to
vegeta attack -rate 500 -duration 5s
A reasonable improvement, but still not there. By default, the FastAPI thread pool has 40 threads. We decided to increase it to 100.
from anyio import to_thread

DEFAULT_FASTAPI_THREAD_POOL_WORKERS = 100

def create_app() -> FastAPI:
   app = FastAPI(lifespan=lifespan)
   ...
   return app

async def lifespan(app: FastAPI) -> AsyncGenerator:
   workers = settings.get_int(
"FASTAPI_THREAD_POOL_WORKERS",
DEFAULT_FASTAPI_THREAD_POOL_WORKERS
   )
   to_thread.current_default_thread_limiter().total_tokens = workers
   ...
vegeta attack -rate 500 -duration 5s
Profiling
We’ve been able to increase our success rate consistently with these changes. But the fastest response is still quite slow, and as you see from snippets above, we aren’t doing anything special in our handler to justify such long response times. So we decided to profile our code during one of these tests to understand where we were spending too much time. To do so, we used pyinstrument to profile both sync and async handlers and got the following traces
Sync
0.464 Runner.run  asyncio/runners.py:86
├─ 0.427 coro  starlette/middleware/base.py:65
│ 	[45 frames hidden]  starlette, fastapi, anyio, asyncio
│    	0.158 run_sync_in_worker_thread  anyio/_backends/_asyncio.py:834
│    	├─ 0.128 [await]  anyio/_backends/_asyncio.py
│    	0.105 run_endpoint_function  fastapi/routing.py:182
│    	└─ 0.105 invoice_handler  billing/routers/webhooks/invoice.py:19
│             	[6 frames hidden]  loguru, core, <built-in>
│    	0.055 ProfilingMiddleware.__call__  starlette/middleware/base.py:24
│    	└─ 0.053 ProfilingMiddleware.dispatch
└─ 0.006 RequestResponseCycle.run_asgi  uvicorn/protocols/http/httptools_impl.py:417
  	[15 frames hidden]  uvicorn, fastapi, starlette, opentele...
Async
0.531 Runner.run  asyncio/runners.py:86
├─ 0.480 coro  starlette/middleware/base.py:65
│ 	[45 frames hidden]  starlette, fastapi, anyio, asyncio
│    	0.180 run_sync_in_worker_thread  anyio/_backends/_asyncio.py:834
│    	├─ 0.158 [await]  anyio/_backends/_asyncio.py
│    	0.124 run_endpoint_function  fastapi/routing.py:182
│    	└─ 0.124 invoice_handler  billing/routers/webhooks/invoice.py:19
│       	├─ 0.082 run_in_threadpool  starlette/concurrency.py:35
│             	[6 frames hidden]  loguru, core, <built-in>
│    	0.046 ProfilingMiddleware.__call__  starlette/middleware/base.py:24
│    	└─ 0.045 ProfilingMiddleware.dispatch  billing/main.py:227
│       	└─ 0.043 call_next  starlette/middleware/base.py:31
│             	[9 frames hidden]  starlette, anyio, asyncio
If you pay close attention you’ll notice that both cases take roughly the same time (~500ms). However, only ~200ms were spent on the handler. Something else in the request lifecycle was taking ~300ms and making requests slower. We then expanded the trace and, to our surprise, the issue was in producer: Producer = Depends(Producer). The SQS message producer was instantiating a SQS client, which would make a request to validate the queue in SQS. But resolving handler dependencies follows the same async/threading rules explained previously. It meant that we were still blocking the main web server thread with a synchronous call.
Profile with SQS request
1.240 Runner.run  asyncio/runners.py:86
├─ 1.215 coro  starlette/middleware/base.py:65
│  ├─ 1.014 ExceptionMiddleware.__call__  starlette/middleware/exceptions.py:53
│  │  └─ 1.014 AsyncExitStackMiddleware.__call__  fastapi/middleware/asyncexitstack.py:12
│  │ 	└─ 1.014 APIRouter.__call__  starlette/routing.py:697
│  │    	├─ 1.012 APIRoute.handle  starlette/routing.py:265
│  │    	│  └─ 1.012 app  starlette/routing.py:63
│  │    	│ 	├─ 0.824 app  fastapi/routing.py:217
│  │    	│ 	│  ├─ 0.487 solve_dependencies  fastapi/dependencies/utils.py:508
│  │    	│ 	│  │  ├─ 0.486 solve_dependencies  fastapi/dependencies/utils.py:508
│  │    	│ 	│  │  │  └─ 0.486 get_queue  billing/sqs/invoice.py:21
│  │    	│ 	│  │  │ 	├─ 0.478 SqsSimpleQueue.__init__  aws/sqs/queue.py:136
│  │    	│ 	│  │  │ 	│  ├─ 0.335 _get_queue_url_create_if_necessary  aws/sqs/queue.py:160
│  │    	│ 	│  │  │ 	│  │  └─ 0.335 SQS._api_call  botocore/client.py:544
│  │    	│ 	│  │  │ 	│  │ 	└─ 0.335 SQS._make_api_call  botocore/client.py:925
│  │    	│ 	│  │  │ 	│  │    	├─ 0.325 SQS._make_request  botocore/client.py:1013
│  │    	│ 	│  │  │ 	│  │    	│  └─ 0.325 Endpoint.make_request
botocore/endpoint.py:113
Singleton
Since we don’t need to instantiate the SQS client for every request, we moved it to a Singleton and got the following results.
Profile after moving to Singleton
0.212 Runner.run  asyncio/runners.py:86
├─ 0.193 coro  starlette/middleware/base.py:65
│  ├─ 0.186 ExceptionMiddleware.__call__  starlette/middleware/exceptions.py:53
│  │  └─ 0.186 AsyncExitStackMiddleware.__call__  fastapi/middleware/asyncexitstack.py:12
│  │ 	└─ 0.186 APIRouter.__call__  starlette/routing.py:697
│  │    	└─ 0.186 APIRoute.handle  starlette/routing.py:265
│  │       	└─ 0.186 app  starlette/routing.py:63
│  │          	├─ 0.155 app  fastapi/routing.py:217
│  │          	│  └─ 0.155 run_endpoint_function  fastapi/routing.py:182
│  │          	│ 	└─ 0.155 invoice_handler  billing/routers/webhooks/invoice.py:23
│  │          	│    	├─ 0.137 run_in_threadpool  starlette/concurrency.py:35
│  │          	│    	│  └─ 0.137 run_sync  anyio/to_thread.py:12
│  │          	│    	│ 	└─ 0.137 run_sync_in_worker_thread  anyio/_backends/_asyncio.py:834
│  │          	│    	│    	├─ 0.120 [await]  anyio/_backends/_asyncio.py
│  │          	│    	│    	├─ 0.007 CapacityLimiter.__aenter__  anyio/_backends/_asyncio.py:1796
│  │          	│    	│    	│  └─ 0.007 CapacityLimiter.acquire  anyio/_backends/_asyncio.py:1857
│  │          	│    	│    	│ 	└─ 0.007 CapacityLimiter.acquire_on_behalf_of  anyio/_backends/_asyncio.py:1860
│  │          	│    	│    	│    	└─ 0.007 cancel_shielded_checkpoint  anyio/_backends/_asyncio.py:469
│  │          	│    	│    	│       	└─ 0.007 sleep  asyncio/tasks.py:627
│  │          	│    	│    	│          	├─ 0.006 [await]  asyncio/tasks.py
│  │          	│    	│    	│          	└─ 0.001 [self]  asyncio/tasks.py
│  │          	│    	│    	├─ 0.006 checkpoint  anyio/_backends/_asyncio.py:446
│  │          	│    	│    	│  └─ 0.006 sleep  asyncio/tasks.py:627
│  │          	│    	│    	│ 	└─ 0.006 [await]  asyncio/tasks.py
│  │          	│    	│    	└─ 0.003 WorkerThread.start  threading.py:938
│  │          	│    	│       	└─ 0.003 Event.wait  threading.py:604
│  │          	│    	│          	└─ 0.003 Condition.wait  threading.py:288
│  │          	│    	│             	└─ 0.003 lock.acquire  <built-in>
│  │
vegeta attack -rate 500 -duration 5s
Refactor
Now we were seeing numbers more in line with expected web server throughput, but we were still bothered about a minor code aesthetics detail in the handler. This call await run_in_threadpool(producer.send_message, body_str). It doesn’t look good, so we worked on a minor refactoring to move the async call to a dependency and make the handler synchronous.
DEFAULT_FASTAPI_THREAD_POOL_WORKERS = 200

async def get_body(request: Request) -> str:
   body = await request.body()
   return body.decode("utf-8")

@router.post(“/invoice”)
def invoice_handler(
   body_str: str = Depends(get_body),
   producer: Producer = Depends(Producer),
) -> JSONResponse:
   try:
Invoice.model_validate_json(body_str)
       producer.send_message(body_str)
   except ValidationError as e:
       ...
   except Exception as e:
       ...
   return JSONResponse(status_code=200, content={...})
vegeta attack -rate 500 -duration 5s
These numbers look reasonably good for a single worker process running on a single Kubernetes pod. Then we decided to run a final test aiming at 200 RPS for a couple of minutes to see if it sustains the RPS or if it was just an effect of test duration.
vegeta attack -rate 200 -duration 4m (sustainable 200 RPS)
Wrap up
All in all, we didn’t make our web server 5x faster, but fixed some issues that were making it 5x slower. We were able to go from 40 RPS to sustainable 200 RPS by understanding how FastAPI handles sync/async requests, increasing the worker thread pool size for sync requests, removing blocking calls from async requests and dependency resolution and avoiding explicit calls to the worker thread pool. Moreover, profiling has proven once more being a helpful tool to catch hidden performance issues, like the synchronous dependency resolution in our case.
Looking for a multi-carrier shipping platform?
With Shippo, shipping is as easy as it should be.
- Pre-built integrations into shopping carts like Magento, Shopify, Amazon, eBay, and others.
- Support for dozens of carriers including USPS, FedEx, UPS, and DHL.
- Speed through your shipping with automations, bulk label purchase, and more.
- Shipping Insurance: Insure your packages at an affordable cost.
- Shipping API for building your own shipping solution.
Stay in touch with the latest insights
Be the first to get the latest product releases, expert tips, and industry news to help you save time and money on shipping.
Loading...
Thanks for your submission!


